How big a difference matters
The smallest effect worth detecting — a mean difference (Cohen's d), a correlation (r), or a change in proportion. Smaller effects need larger studies.
Every Zemi Dossier converts its major hypotheses into power-calculated next studies: the endpoint that carries the decision, the effect worth detecting, and the exact sample size, design, budget, and timeline needed to detect it. The calculations are live, editable spreadsheet formulas — not screenshots — so your team can drop in its own assumptions and watch the required study resize in real time.
Reports tell you what is interesting. Power calculations tell you what it costs to find out, whether you can afford to be wrong, and which study to run first. It is the bridge from synthesis to spend.
In plain terms: before you run an experiment, a power calculation tells you how large it has to be to give a fair answer. It links four quantities so that fixing any three determines the fourth.
The smallest effect worth detecting — a mean difference (Cohen's d), a correlation (r), or a change in proportion. Smaller effects need larger studies.
The significance threshold, conventionally 0.05 — the risk of calling an effect real when it is not. Tighter alpha raises the required sample.
The probability of detecting a true effect, conventionally 0.80 or 0.90. Under-powered studies miss real effects and waste the budget that funded them.
Given the effect, alpha, and power, the math returns n — per arm, per subject, or per cell — which a design then inflates for dropout, clustering, or enrichment.
Sample size is where good science is won or lost on paper. The same hypothesis can be a fundable, decisive study or an uninterpretable waste — the difference is whether the power calculation was done honestly and up front.
Too few subjects and a real effect is missed. The program reads the null as "it doesn't work" and kills a winner — or burns the budget proving nothing.
Too many subjects wastes money, time, and — in clinical work — exposes more people than the question requires.
Sample size drives cost, enrollment time, and site count. The power row is where a hypothesis acquires a price tag and a schedule.
When several studies compete for funding, the cheapest study that resolves the most uncertainty should run first. Power rows make that comparison explicit.
Each power row is the end of a chain that starts in the report's evidence and ends at a buyer decision. The assumptions are not invented — effect sizes are anchored to a cited source wherever one exists, and labeled as assumption-bounded where one does not.
What is the field actually gated by?
What result would strengthen or break it?
The measurement that carries the decision, and the effect worth detecting (source-anchored).
Effect, alpha, power → computed n → design n with dropout and enrichment.
Cost and schedule, and the decision it resolves: build, fund, avoid, monitor, partner, or test next.
The Power Calculations sheet ships as working spreadsheet math. The assumption cells are yours to change — substitute your own effect size, alpha, power, or dropout and every sample size, design n, budget, and timeline downstream recomputes instantly. It turns the dossier from a document you read into an instrument you run.
Effect size, baseline/variance, alpha, target power, and attrition are editable cells. Disagree with our assumption? Type yours and the study resizes.
Computed n is a live NORM.S.INV / ROUNDUP formula wired to the inputs, mirrored by a verified static value so the number is never ambiguous.
Each hypothesis carries a sensitivity block — effect × {1.0, 0.75, 0.5} against power {0.80, 0.90} — so you see how the study grows as assumptions soften.
Textbook two-proportion benchmarks (30%→20% ≈ 294/arm; 30%→25% ≈ 1251/arm) sit in the sheet so the math is verifiable against known answers.
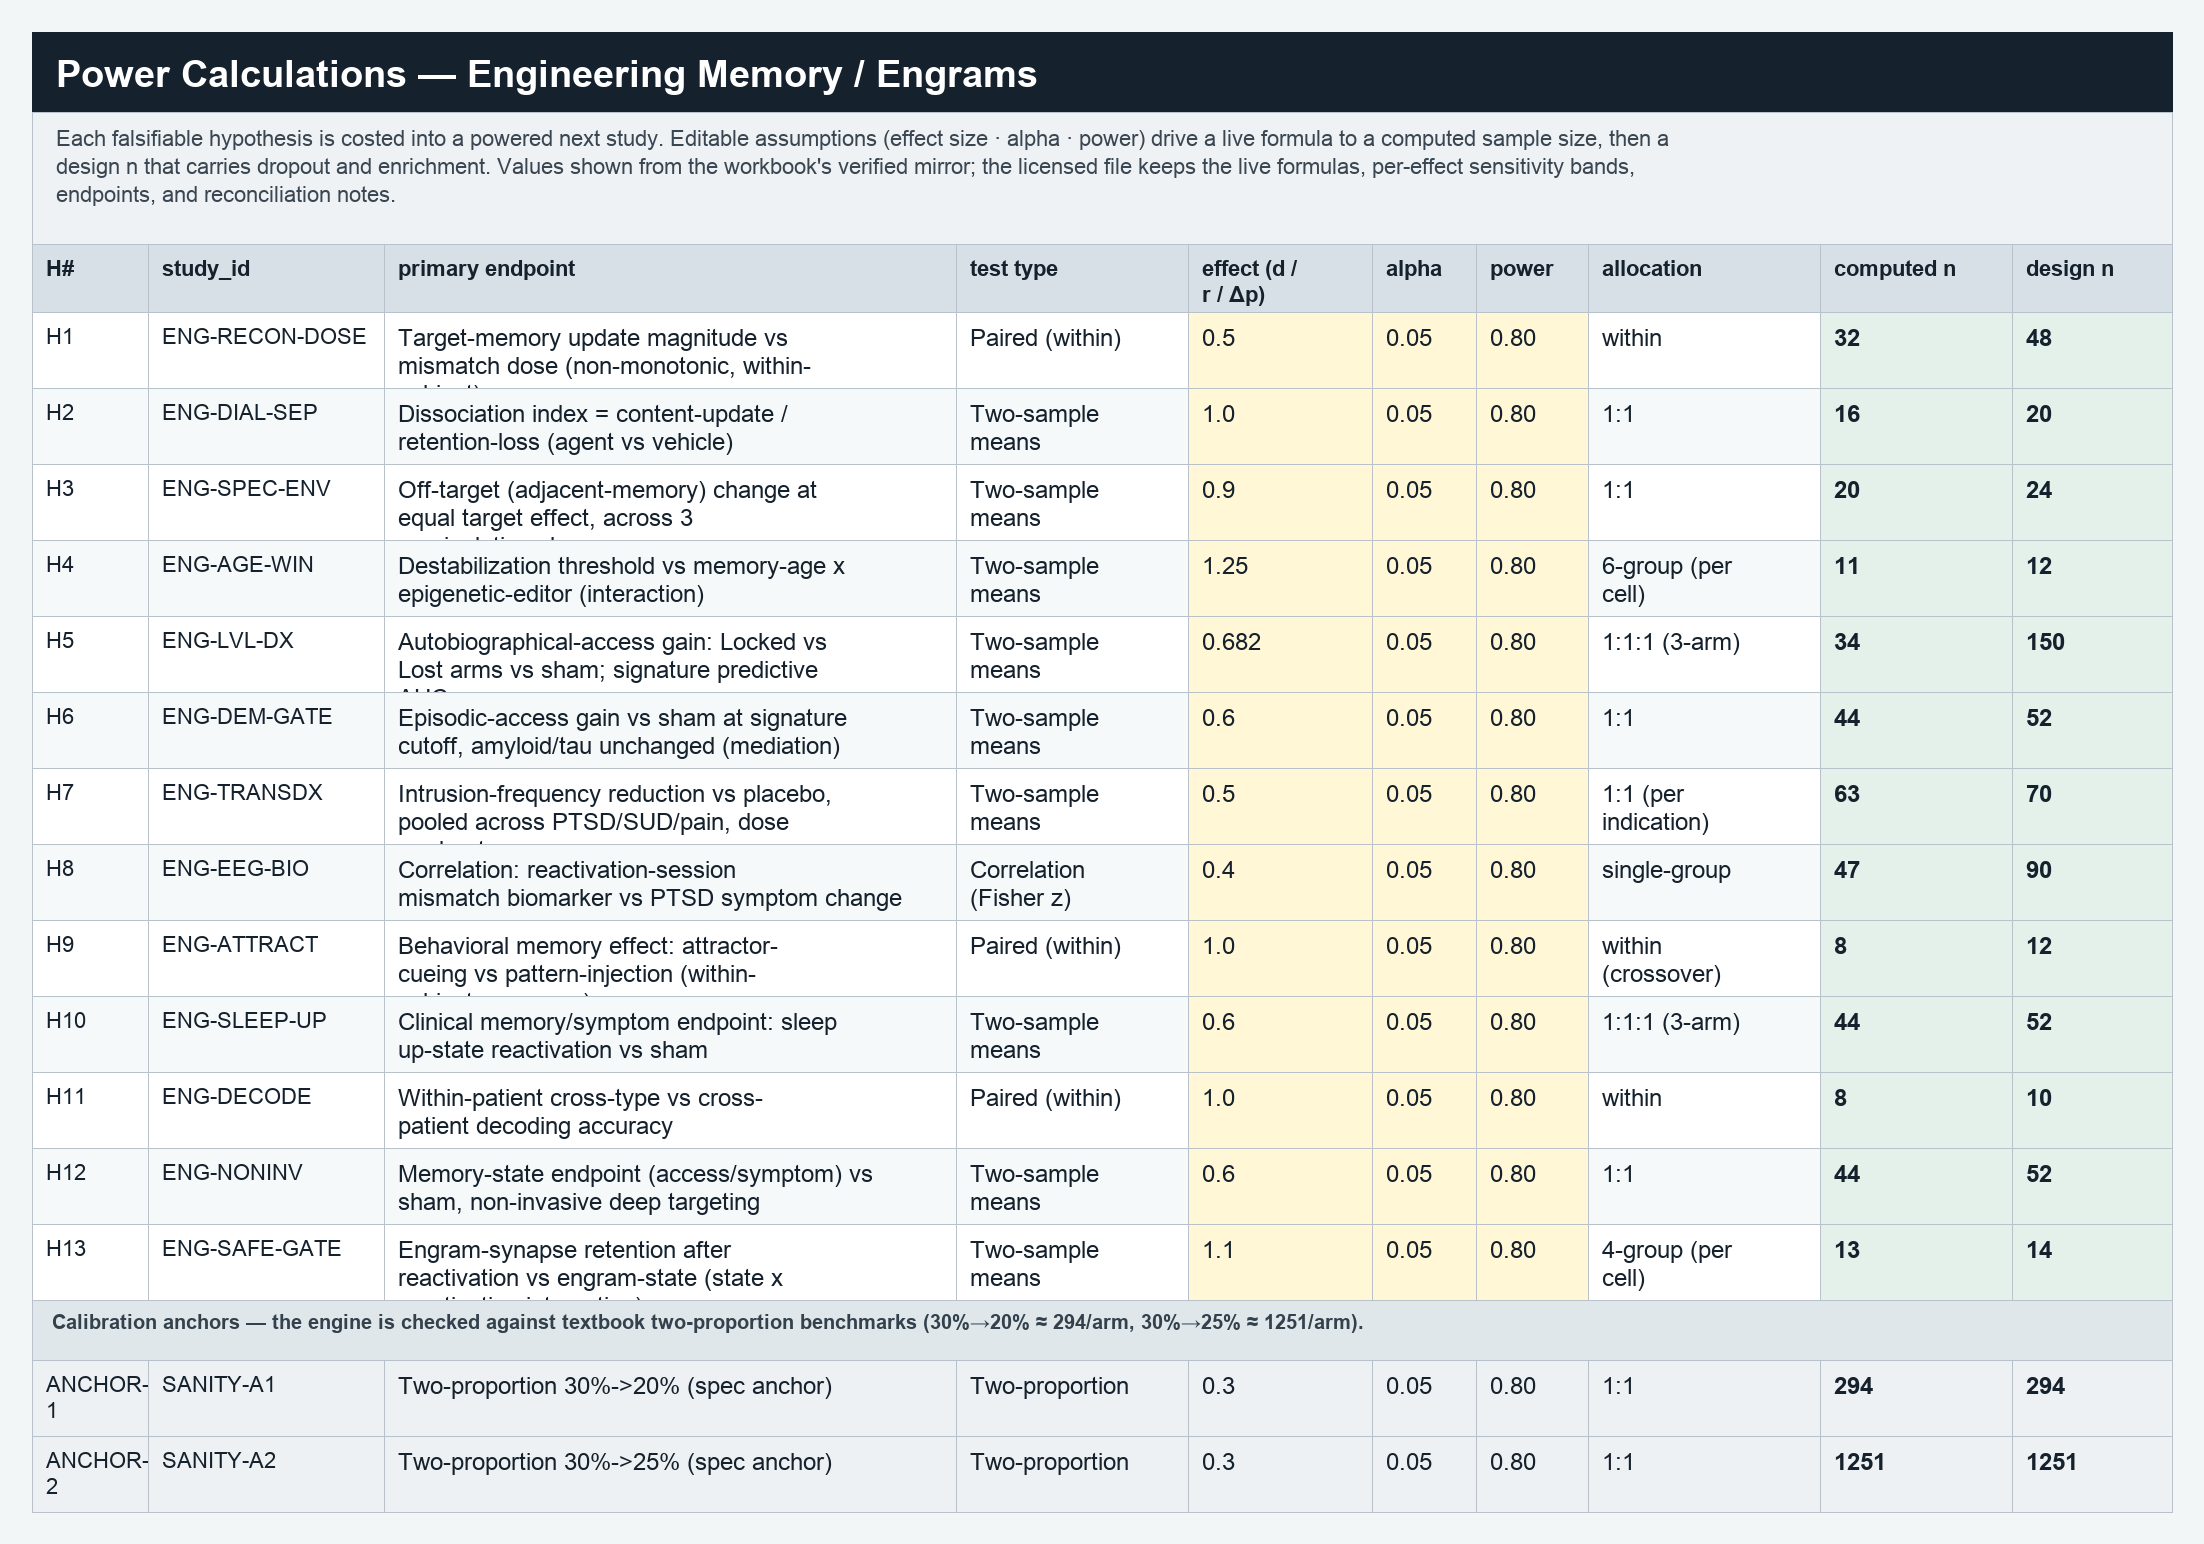
A sample of the live Power Calculations sheet from the Engineering Memory dossier. Editable assumptions on the left drive the computed sample size and the design n that carries dropout and enrichment. These are real values from the workbook.
| Hypothesis | Primary endpoint | Test | Effect | Alpha | Power | Computed n | Design n |
|---|---|---|---|---|---|---|---|
| H1 · mismatch dose | Target-memory update vs mismatch dose (within-subject) | Paired t | d = 0.5 | 0.05 | 0.80 | 32 / subject | 48 |
| H3 · specificity | Off-target memory change at equal target effect | Two-sample means | d = 0.9 | 0.05 | 0.80 | 20 / arm | 24 |
| H5 · Lost-vs-Locked dx | Autobiographical-access gain, Locked vs Lost vs sham | Two-sample means | d = 0.682 | 0.05 | 0.80 | 34 / arm | 150 |
| H8 · dose biomarker | Reactivation mismatch biomarker vs PTSD symptom change | Correlation (Fisher z) | r = 0.4 | 0.05 | 0.80 | 47 | 90 |
| Calibration anchor | Two-proportion 30%→20% (textbook check) | Two-proportion | Δ = 10pts | 0.05 | 0.80 | 294 / arm | 294 |
Power rows are bespoke to each dossier's science: the endpoints, designs, and effect sizes differ, so the number and shape of the calculations differ too. A sample of the catalog — each count is the power rows carried in that dossier's workbook.
| Dossier | Domain | Power rows | Decision instrument |
|---|---|---|---|
| RNA Editing & the Permanence Spectrum | Gene Therapy | 80 | Permanence Spectrum Map |
| Fibrosis as Failed Resolution | Immunology | 71 | Resolution-Restoration Classifier |
| AI Biology Drug Discovery | Digital Health | 54 | Dynamic Validation Gate Map |
| Next-Generation Immuno-Oncology Platforms | Oncology | 42 | Therapeutic Index Stack |
| AI Clinical Validation & Digital Biomarkers | Digital Health | 40 | Prospective Validation Gate Map |
| Epigenome Editing & Tunable Permanence | Gene Therapy | 34 | Durability-Limiting-Factor Classifier |
| AI Multi-Omics Variant-to-Rescue | Rare Diseases | 32 | Variant-to-Rescue Decision Stack |
| Engineering Memory / Engrams | Neurology | 28 | Engram-State Classifier |
| Organ-on-Chip / NAM Qualification | Emerging Med Tech | 18 | Context-of-Use Qualification Ladder |
| Precision AMR Countermeasures | Infectious Disease | 17 | Resistance-Cornering Stack |
| Mitochondrial Medicine Permanence Ladder | Rare Diseases | 15 | Permanence-Match Ladder |
| Perfusable Vascular Networks | Emerging Med Tech | 13 | Vascularization Readiness Gate Map |
Counts reflect the power-calculation rows carried in each dossier's Evidence & Decision Workbook. The full catalog spans all nine domains; browse it from the dossier library.
Request access to inspect a full Evidence & Decision Workbook, or open the Engineering Memory sample to see the power layer in context.